
As emissions management programs mature, operators are finding more ways to put measurement data to work. Connecting survey findings with operational context can help teams identify opportunities to improve performance and make more informed decisions. We sat down with Bailey Fosdick, Bridger’s VP of Analytics, to understand how actionable emissions data can support improved efficiency and stronger business performance, and how new tools make this possible.
Q1. You recently stepped into the role of VP of Analytics at Bridger. What do you see as the biggest opportunity for analytics to change how oil and gas operators understand and manage their emissions?
Historically, emissions measurement data told operators what was happening at a single point in time and at a single location. Accurate, localized quantification helped make LDAR more efficient, and that was a big win for field crews working to find and verify leaks. Today, we’re asking a different question: how can a single data point carry value far beyond one moment and one place?
Emissions programs have matured, and operators now collect data at a much higher cadence. That creates the opportunity. We can look back across the data to spot trends, such as a piece of equipment whose emissions are still low but steadily rising, and turn those findings into predictions. Operators sometimes ask, half-jokingly, “When will you be able to tell me where an emission will happen before it even starts?” It sounds futuristic, but analytics on rich emissions datasets, combined with operational context, are moving us closer to that reality.
Q2. How does looking at emissions performance over time change the decisions operators can make?
After we survey an operator’s assets, an analyst on their team may run a preliminary analysis and flag a notable concern. They raise it with leadership, and the first question is, “Is this an ongoing problem?” A follow-up survey is the most direct way to answer that question.
The value of emissions data compounds with each additional survey. An annual survey gives operators a baseline. Semi-annual surveys let them measure change. Quarterly surveys support real trend analysis. Each added survey also gives operators more confidence to act on the data, and that matters: asset-wide retrofit programs are expensive, and misallocating those resources is costly. Trends over time help operators hone in on consistent, reliable signals they can act on.
Q3. We often talk about making methane data actionable. From an analytics perspective, what does “actionable” actually mean?
Actionable data lets people make decisions quickly. From an analytics perspective, that takes two things: transparent analyses and trustworthy data. You need both. Without transparent analyses, decision makers question whether the summaries answer the right questions. Without trustworthy data, there’s always that lingering question: Is it telling you what’s really happening?
Q4. Bridger works with operators across large and diverse asset portfolios. What becomes possible when emissions data is analyzed consistently across hundreds or thousands of facilities?
Over the past several years, the oil and gas industry has expanded its methane mitigation efforts, but levels of investment vary across operators. To understand real differences between operators, you need data collected with the same technology, processed through the same pipeline and summarized with the same metrics. That gives operators a consistent basis for comparison. That’s exactly what we built with Bridger Benchmarking, the first industry benchmark built on source-level measurement data. We launched it this fall, and it shows production operators where they stand relative to their basin peers. We believe it will help operators see whether they’re leading, keeping pace with the industry, or falling behind.
Q5. One of your areas of research has been measurement-based emissions inventories. What are some of the challenges operators face when trying to turn emissions measurements into a complete picture of performance?
The science of measurement-based emission inventories has advanced quickly. Sustained attention from researchers has significantly improved our understanding of how to estimate total annual emissions. Today, several inventory approaches give reasonable estimates under different scenarios, including simulation-based mechanistic models, statistical models and hybrid measurement-informed inventories. Their estimates are converging, but they still differ for reasons we don’t fully understand. Continued research will continue to close that gap.
In practice, operators can’t wait for the science to settle. Every measurement adds knowledge, but every dollar spent on measurement is a dollar not spent on mitigation. So the challenge for operators is knowing when their inventory is good enough, and the answer depends on its purpose. If it’s for a regulatory reporting program, the program’s protocol sets the bar. If it’s for identifying the next major mitigation action, a materiality lens may be more useful. If it’s for investor reporting, a consistent approach year over year is critical to demonstrating progress. And if it’s for benchmarking against peers, comparability matters most, and a simpler inventory method can provide a stronger foundation than a complex one.
Q6. Any other thoughts you’d like to share?
I’m excited about where the industry is headed with emissions and operational intelligence. For years, the core questions were about the data itself: Can we measure methane emissions reliably and accurately? Can we do it at scale across large asset portfolios? Thanks to advances in measurement technology, the answer to both is increasingly yes. We’re leaving the era of data and entering the era of analytics, where operators extract the full value of that data for capital planning, facility engineering, understanding asset health, and optimizing field crew activities.
At Bridger, we’ve only started to scratch the surface of what analytics can reveal in our data. The most valuable insights are still ahead of us.
Bailey’s perspective highlights how much more operators can learn from the emissions data they already collect. From prioritizing equipment repairs and upgrades, to assessing performance against peers, analytics can help teams put that information to use with confidence. As new tools and approaches develop, the opportunities to inform capital planning, support field crews, and strengthen business performance will continue to grow.
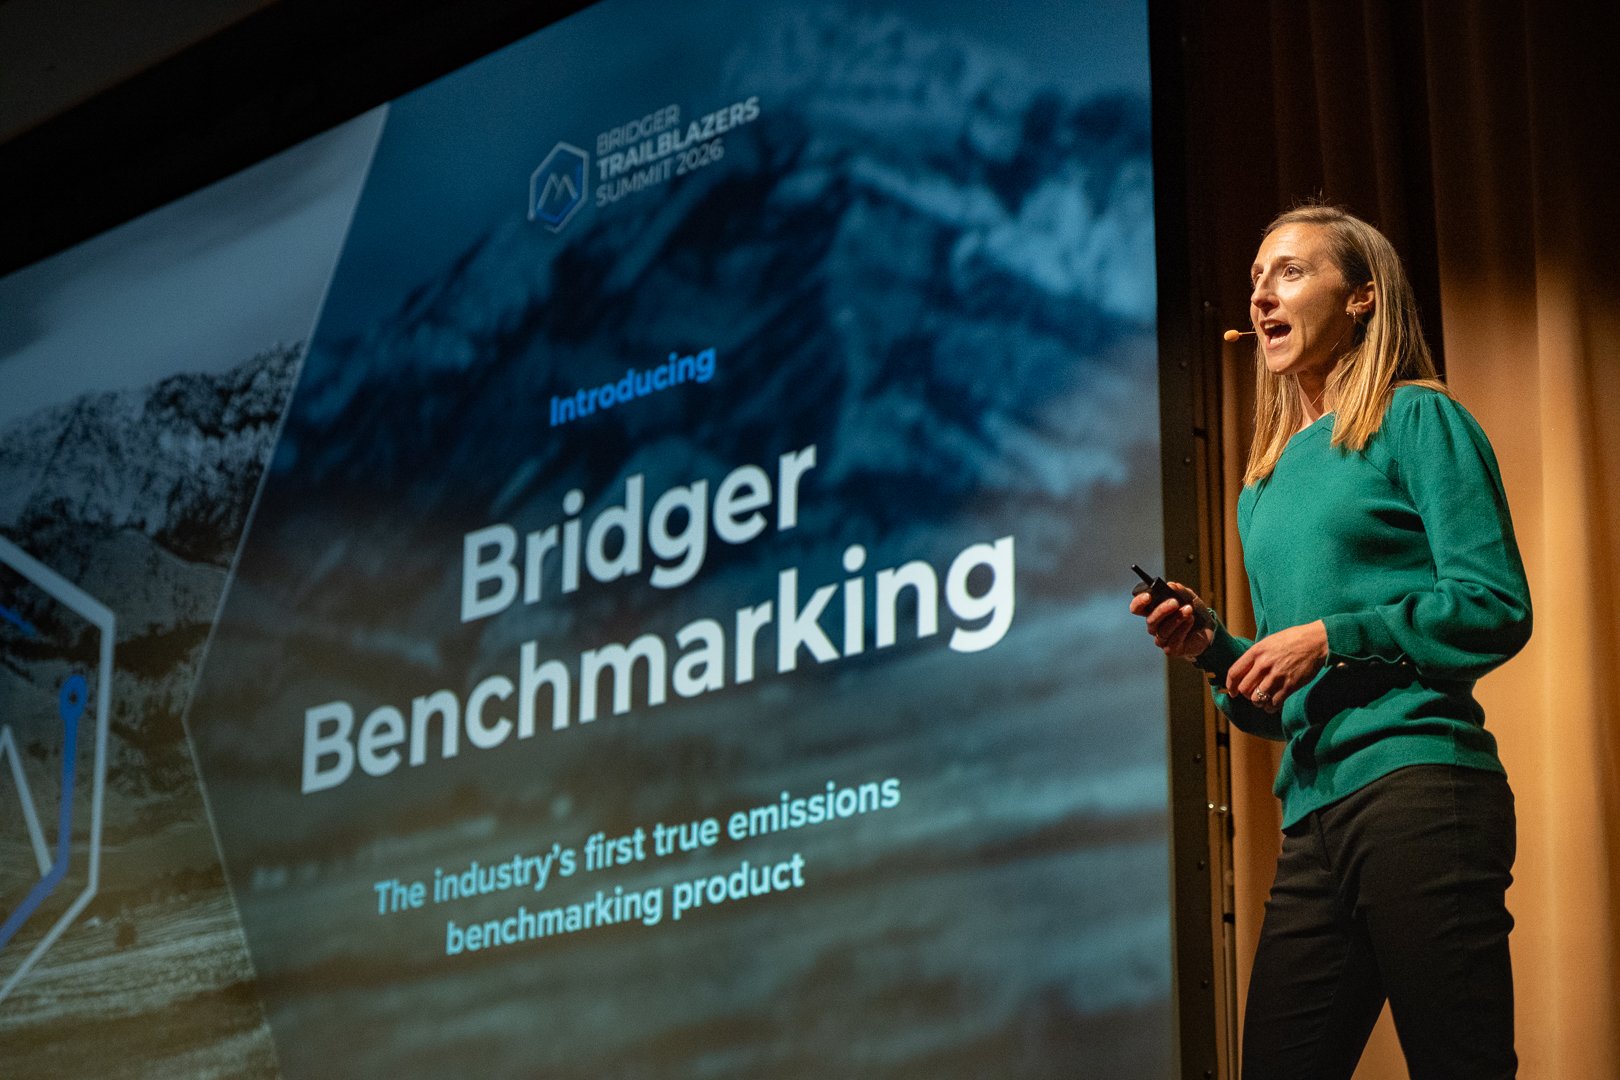
Dr. Bailey Fosdick is Vice President of Analytics at Bridger Photonics, where she leads the team responsible for transforming emissions measurement data into trusted, actionable insights for oil and gas operators. With deep expertise in statistics, data science, and methane emissions analytics, Bailey focuses on developing rigorous, scalable approaches that help operators better understand emissions performance and make more informed operational decisions.
Before joining Bridger, Bailey led data science initiatives at multiple organizations including GTI Energy, applying statistical modeling, data science, and AI to complex challenges across the energy sector. Bailey holds a Ph.D. in Statistics from the University of Washington.